Unlike other competitors Bacula has an open format metadata catalog, even in the Enterprise version. With the increasing evolution of data science, this is indispensable for obtaining essential information for quality of service, problems forecast, bottleneck identification and effective monitoring.
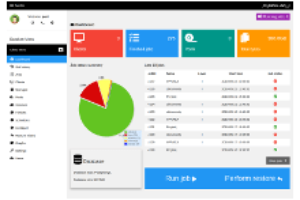
As shown in Figure 1, this article provides a model for monitoring Bacula’s PostgreSQL database metadata with Grafana.
Figure 1. Grafana Bacula USA Template
Our template displays the following information:
- Jobs running total and list.
- Stalled Jobs.
- Last 500 completed Jobs list.
- The current time and last Director to Catalog access.
- Space occupied by the Bacula database on Disk.
- DB average transactions per second.
- Number of configured Clients and Pools.
- All backup volumes occupation (eg on Disk).
- Total number of volumes.
- Average backup speed by job type.
- Average percentage reduction by compression or deduplication of backups grouped by job type.
- All backups performed for the same Job size sum.
Grafana
Grafana is an open source visualization tool that can be used in several different data stores, but is most commonly used in conjunction with Graphite, InfluxDB and Elasticsearch and Logz.io. It contains a unique analyzer that allows easy editing of metrics and functions.
Installation
There are installation packages and repositories for various operating systems on the Grafana website. In our case, we did the installation on CentOS 7 64 bit using the following commands [1,2].
sudo yum localinstall https://s3-us-west-2.amazonaws.com/grafana-releases/release/grafana-5.2.2-1.x86_64.rpm
sudo yum install -y initscripts fontconfig freetype* urw-fonts

firewall-cmd --permanent --zone=public --add-port=3000/tcp
service firewalld restart

sudo service grafana-server start
sudo systemctl enable grafana-server.service

grafana-cli plugins install grafana-piechart-panel
In this case, we have already installed the grafana-piechart-panel plugin, used by our template.
To access Bacula’s PostgreSQL database, create a pgsql user with read-only access. For example:
CREATE USER grafanareader WITH PASSWORD 'password';
GRANT USAGE ON SCHEMA public TO grafanareader;
GRANT SELECT ON all tables in schema public TO grafanareader;
Access Grafana at the address: http://server_ip:3000. The initial user and password are: admin/admin.
As shown in Figure 2, create a PostgreSQL access datasource for the Bacula database. However, use the grafanareader user created in the previous step.
Figure 2. Bacula Pgsql Datasource Creation
Download in our dashboard template (json) HERE [3]. Unzip it.
According to Figure 3, import the dashboard through the json file.
Figure 3. Dashboard Import
Ready! Enjoy the configured panels and make the modifications you want.
Future Works
Grafana can integrate with Collectd or even bind with Zabbix, providing useful information about the computational resources of the Bacula server and the execution state of its daemons, but this should require the use of other datasources and will be the subject of future work.
Another Templates
- Grafana Dashboards by Molinux (PostgreSQL, Zabbix). https://github.com/molinux/grafana
- Bacula by hapito (MySQL). https://grafana.com/dashboards/4427
References
[1] https://grafana.com/grafana/download?platform=linux
[2] http://docs.grafana.org/installation/rpm/
[3] https://github.com/molinux/grafana
Disponível em:  Português (Portuguese (Brazil))
 English
 Español (Spanish)


